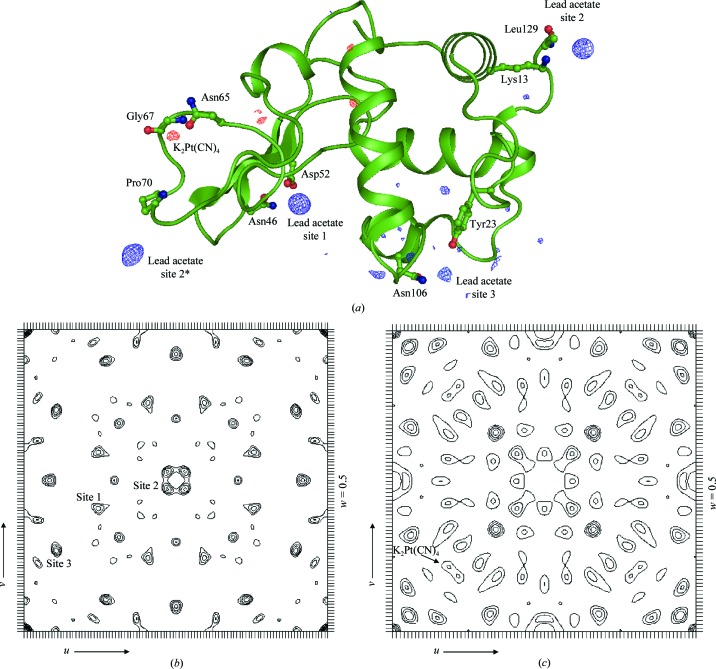
Figure 4.
(a) Difference Fourier (F o − F c) maps calculated for lysozyme derivatized with lead acetate (in blue density) and with potassium tetracyanoplatinate(II) (in red density) and contoured at the 3σ level. The structure of lysozyme is shown in ribbon representation, with the residues coordinating heavy atoms shown as ball-and-stick models. PyMOL was used to generate the figure. Difference Patterson maps of the lead acetate (b) and potassium tetracyanoplatinate(II) (c) derivatives of lysozyme calculated for the Harker section w = 0.5 with diffraction data between 50 and 3.8 Å resolution. The sections are contoured with 1σ increments starting at 2σ. The respective self Patterson vectors from the individual heavy-atom-binding sites are indicated in the Harker sections.

