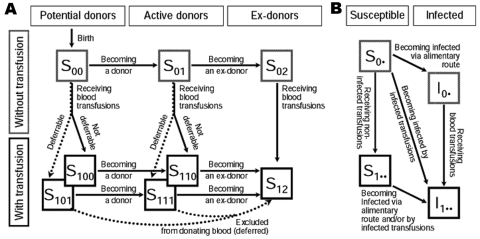
Figure 1.
A) States and transitions for the model of blood transfusion in the absence of an infection. B) Routes of infection. The arrows representing deaths out of all states are omitted. Paths of donor exclusion are plotted by dotted arrows. S00, nonrecipients who do not donate; S01, nonrecipients who donate; S02,nonrecipients who are excluded from donating; S100,recipients who do not donate; S101, recipients who become excluded from donating; S110, recipients who donate; S111, recipients who become excluded from donating; S12, recipients who are excluded from donating. Indices replaced by a dot (panel B) represent all other possible states (e.g., S0• represents S00, S01, or S02).

