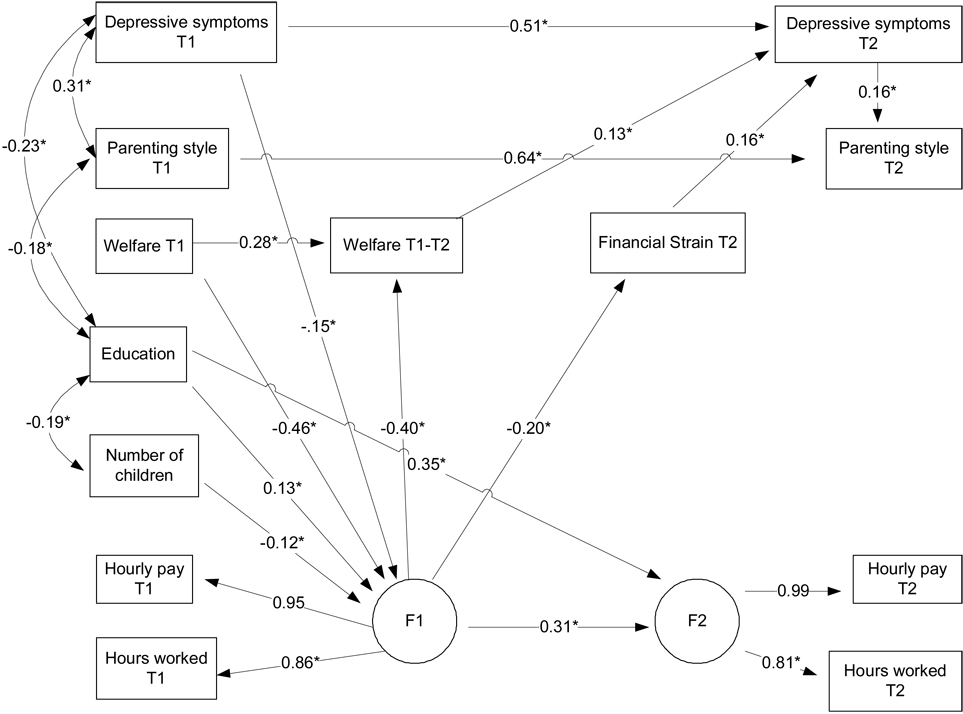
Figure 2.
Final Structural Equation Model. N = 177 (1 case with missing data); chi-square = 67.83, p = .11, CFI = .98, RMSEA = .04. The data are nonnormal and the robust Satorra-Bentler chi-square = 72.6, p=.06. Standardized parameter estimates shown (*p<.05). Note: F1 = factor representing extent of employment and pay Time 1; F2 = factor representing extent of employment and pay Time 2. Residuals not shown.

