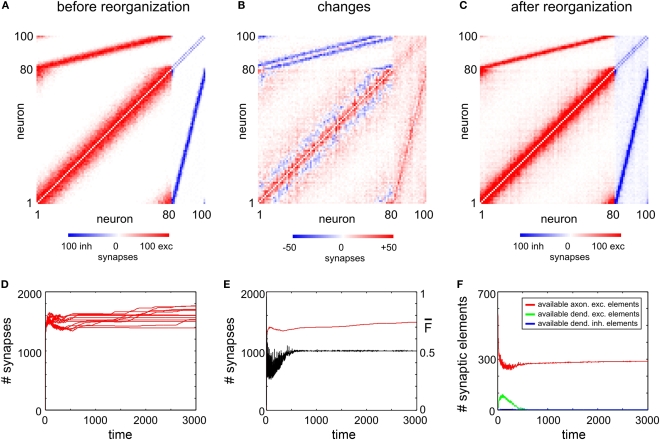
Figure 2.
Juvenile development. The three panels (A–C) show the network connectivity before (A) and after reorganization (C) as well as the absolute change in connectivity (B). The colour coding of each square (see colour bars below panels) indicates the number of binary synapses from neuron j (column) to neuron i (row) (A,C) or the change in synapses numbers (B), respectively. (D) Shows the time course of excitatory synapse numbers per neuron for 12 individual simulations. (E) Shows the course of mean firing probability (black curve) and mean (excitatory) synapse numbers (red curve) averaged over the simulations in (D). (F) Shows the mean amount of vacant synaptic elements over time averaged over the simulations in (D).

