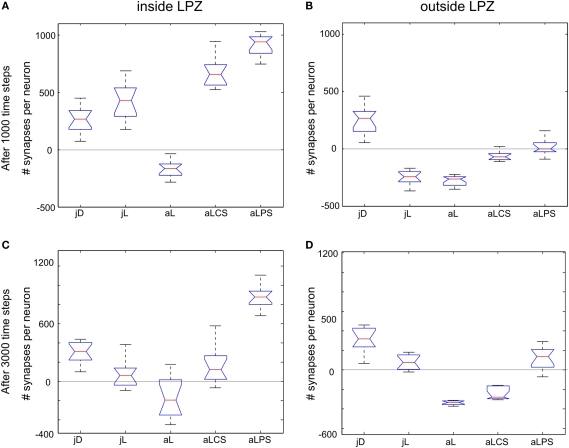
Figure 8.
Group differences. Changes in excitatory synapse numbers per neuron between different stimulation protocols at 1000 (first row; A,B) and 3000 morphogenetic time steps after the lesion (second row; C,D). The figure shows the changes in excitatory synapses inside (left column; A,C) and outside the lesion projection zone (right column; B,D) and its distribution over the 12 data sets used (as shown in Figures 2A,B to 6A,B) as well as the 95 percentile for each group (jD, juvenile development; jL, juvenile lesion; aL, adult lesion; aLCS, adult lesion with continuous stimulation; aLPS, adult lesion with paused stimulation).

