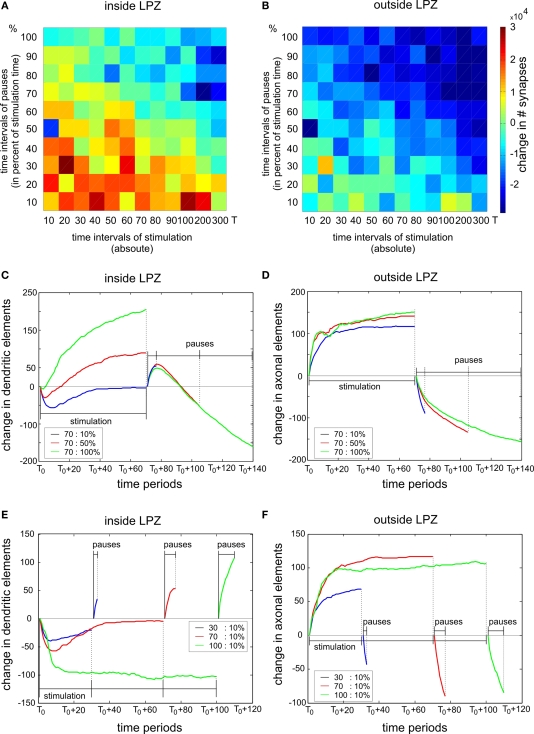
Figure 9.
Trade-off between stimulation and pause times. The left column shows changes inside the LPZ whereas the right column shows changes outside the LPZ. (A, B) Total difference in excitatory synapses between onset of lesion and final connectivity state for different stimulation and pause times. The chosen stimulation times are specified as morphogenetic time steps (x-axis) whereas the chosen pause times are given as percentage values of the stimulation time in 10% increments (y-axis). For example, 100% of pause time means that the pause phase is as long as the stimulation phase. In (C–F) the x-axis gives the time period of each stimulation and pause phase starting at T0. Each curve indicates the mean changes in dendritic and axonal elements during stimulations and pauses for different exemplary combinations of stimulation and pause times. In (C) and (D) we show the impact of varying pause lengths (blue: 10%, red: 50% and green: 100% of stimulation time) whereas in (E) and (F) we show the impact of different stimulation times (blue: 30, red: 70 and green: 100 morphogenetic time steps). Dashed vertical lines mark the ending of the stimulation and pause phases, respectively.

