Fig. 2.
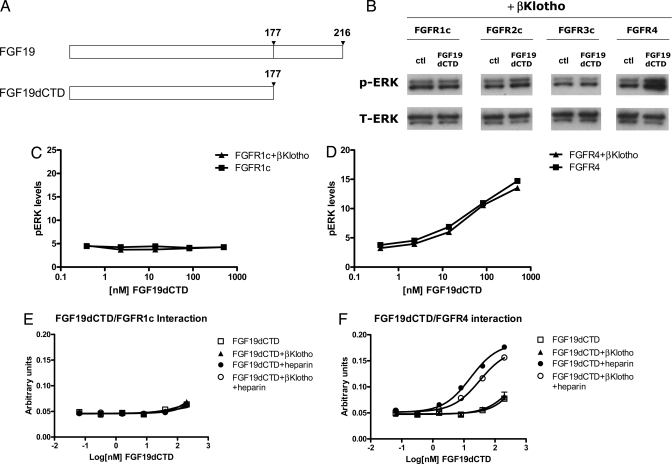
In vitro activity of FGF19dCTD. (A) Schematic diagram showing FGF19 and FGF19dCTD. (B) L6 cells were transfected with expression vectors for FGFR1c, 2c, 3c, and 4 as well as βKlotho. Following overnight serum starvation, cells were stimulated with vehicle or 50 nM recombinant FGF19 for 15 min and snap frozen in liquid nitrogen. Cell lysates were prepared for Western blot analysis using antibodies against phosphorylated ERK1/2 (pERK) or total ERK1/2 (T-ERK). (C) L6 cells were transfected with FGFR1c with or without βKlotho. Following overnight serum starvation, cells were stimulated with recombinant FGF19dCTD for 15 min and snap frozen in liquid nitrogen. Cell lysates were prepared for an MSD assay measuring phosphorylated ERK1/2 level. (D) Similar to (C), L6 cells were transfected with expression vectors for FGFR4 with or without βKlotho and treated with FGF19dCTD. (E) Solid-phase binding assay measuring the interaction between FGFR1c and FGF19dCTD in the presence of heparin or βKlotho. (F) Solid-phase binding assay measuring the interaction between FGFR4 and FGF19dCTD.

