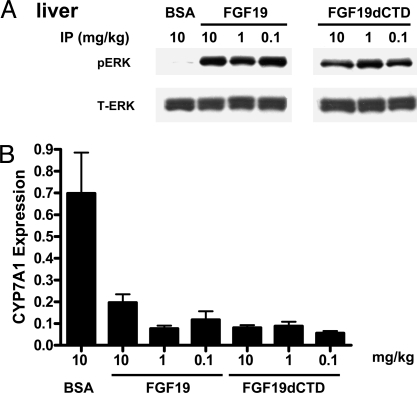
Fig. 4.
FGF19 and FGF19dCTD signaling in liver. (A) Livers were excised from ob/ob mice (four animals per group) treated with 10 mg/kg BSA (BSA), FGF19, or FGF19dCTD (at 0.1, 1, or 10 mg/kg) 15 min after injection. Tissue lysates were prepared and pooled for Western blot analysis using phosphorylated ERK1/2 (pERK) or total ERK1/2 (T-ERK) antibodies. (B) Livers were excised from ob/ob mice (six animals per group) treated with BSA (BSA), FGF19, or FGF19dCTD (at indicted doses) 5 h after injection. Tissue CYP7A1 mRNA levels were measured by quantitative RT-PCR.

