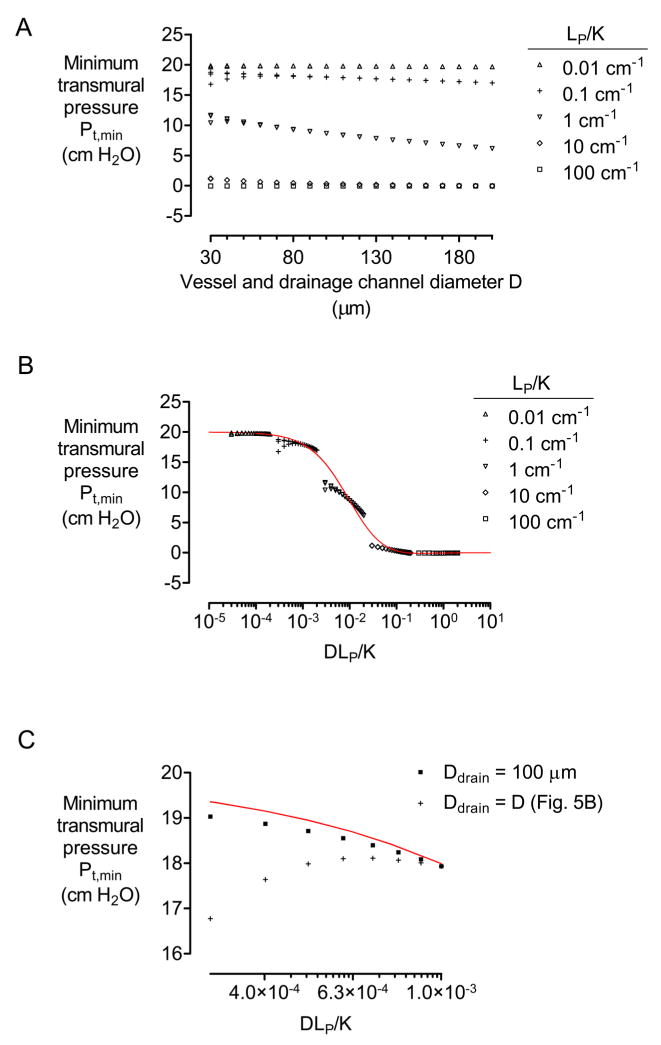
Figure 5.
(A) Plot of minimum transmural pressure Pt,min versus diameter D of vessels and drainage channel. (B) Plot of Pt,min versus a normalized ratio of hydraulic conductivities DLP/K. (C) Plot of Pt,min versus DLP/K for models in which the diameter of the drainage channel remained 100 μm. All models had N = 4, h = 500 μm, L = 1 cm, Pin − Pout = 10 cm H2O, and Pout − Pdr = 20 cm H2O. In (A) and (B), K = 10−12, 10−11, 10−10, 10−9, or 10−8 cm4/dyn·s, and LP = 10−11, 10−10, or 10−9 cm3/dyn·s. In (C), LP = 10−9 cm3/dyn·s and K = 10−8 cm4/dyn·s. Red plots indicate data from Fig. 3C.

