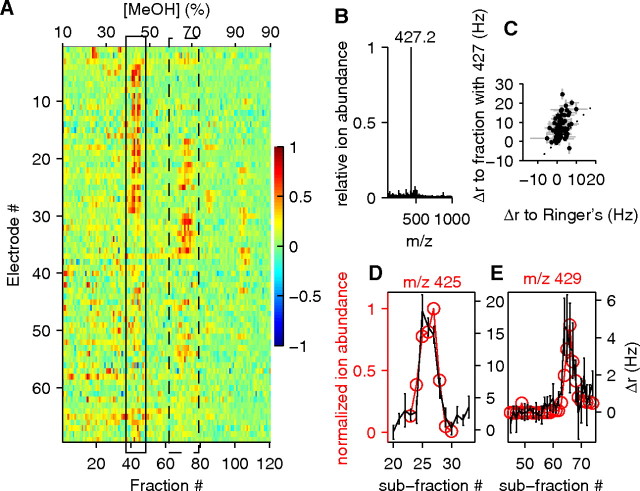
Figure 2.
Characterization of fractions purified by a methanol-water gradient on an ODS column. A, Normalized responses on 69 individual electrodes from 3 preparations to each of 120 different fractions. Neurons are on rows, and fractions are on columns; color scale indicates relative amplitude of response. Note the prevalence of responses to only a few bands of fractions, of which the major ones are highlighted by the black rectangles. The band of fractions in the leftmost rectangle (solid line) was pooled and then further separated by HPLC (resulting in subfractions) for the data in the remaining panels of this figure. B, Example of a repurified subfraction dominated by a single peak (m/z 427) on ESI/MS. Ion abundance is normalized to the intensity of that ion. C, Physiological testing of the subfraction in B (79 electrodes from 2 preparations). The estimated concentration of SS427 in the subfraction was 20 μm. D, E, Plot of the firing rate change measured on two electrodes across subfractions (black curve) and the relative abundance of a particular ion across the same subfractions (red curve). The subfraction numbers in D and E refer to two different repurifications of the first band of fractions in A (rectangle). Error bars indicate SEM across trials.

