
Figure 4.
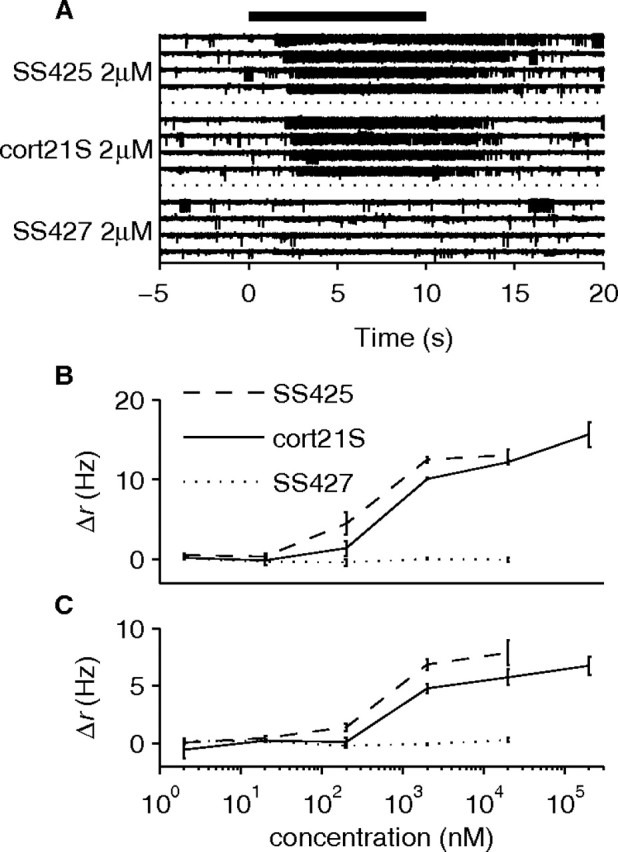
Equivalence of cort21S and SS425 as revealed by neuronal responses. A, Raw voltage recordings on one electrode in response to SS425, cort21S, and SS427. All four presentations of these stimuli are shown (stimuli are shown grouped by identity but were presented in interleaved manner). Each stimulus was presented at 2 μm. The black bar represents the stimulus timing. B, C, Single-unit responses to a concentration series of SS425, cort21S, and SS427. Note the similarity between the dose/response curves of SS425 and cort21S and their difference with the SS427 curve. Both cort21S-responsive neurons displayed an EC50 between 200 nm and 2 μm; the concentration of SS425 in ODS–urine extract was estimated (see Materials and Methods) to be ∼1 μm. Error bars indicate SEM across trials. The neuron in B was recorded on the electrode shown in A.