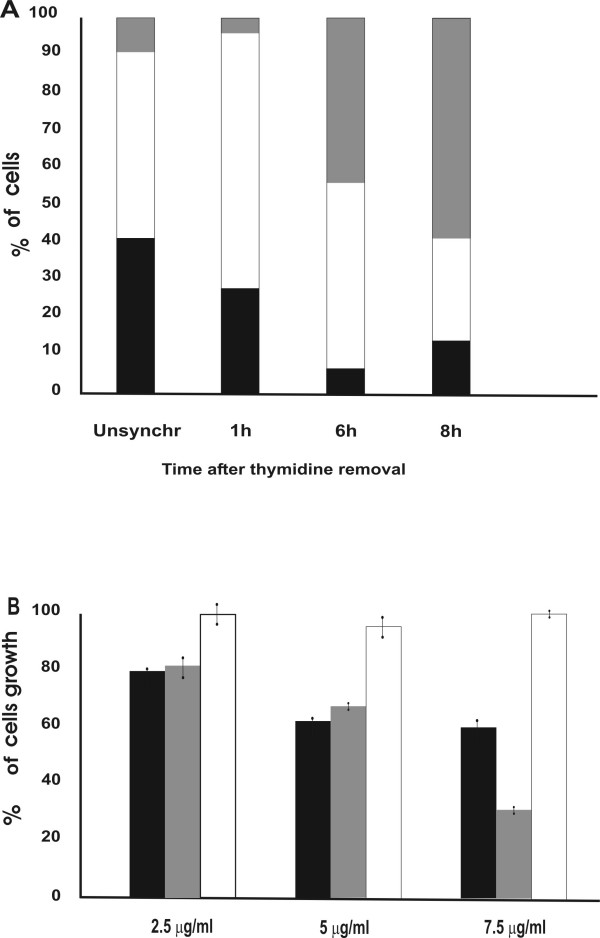
Figure 4.
Effects of the chromatin peptides on the various phases of the cell cycle. A: Cell cycle analysis by FACS of unsynchronized cells and of synchronized cells at 1, 6 and 8 hours after removal of the thymidine block. (black) percentage of cells in G1 phase; (white) percentage of cells in S phase; (grey) percentage of cells in G2/M phase. B: Cell growth after treatment with different concentration of peptide fraction in the various phases of cell cycle as described in the text; (black bars) treatment during S phase; (grey bars) treatment during S+G2 phases; (white bars) treatment during G2 phase as described in the text.

