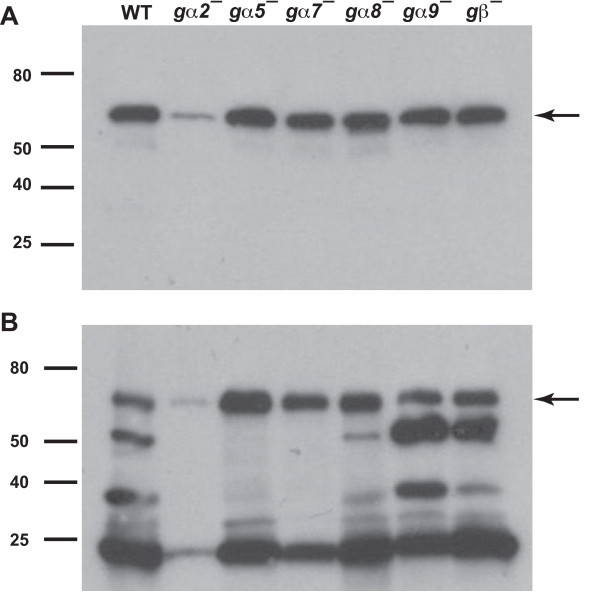
Figure 3.
The accumulation of extracellular AprA and CfaD. The indicated cell types were grown in HL5 and conditioned growth media were collected. Western blots of the conditioned growth media were stained with anti-AprA antibodies (A) or anti-CfaD antibodies (B). The arrow in A indicates the 60 kDa AprA band, and the arrow in B indicates the 62 kDa CfaD band. The lower molecular mass bands stained in B are breakdown products of CfaD [3]. Data are representative of three independent experiments.

