
Figure 1.
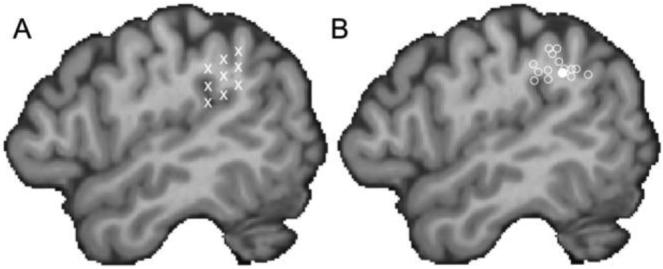
Stimulation sites. A) In each subject, the termination of the posterior ascending ramus of the Sylvian fissure was identified and marked using a frameless stereotaxy system. Then a 3 × 3 grid of markers was overlaid to label nine possible SMG testing sites. B) In the main experiment, the final testing site for all 14 participants is shown (open circles) as well as the mean group location (filled circle). Both panels are shown on a para-saggital plane through a single participant's brain after normalizing to the standard MNI152 space with an affine registration (Jenkinson and Smith, 2001).