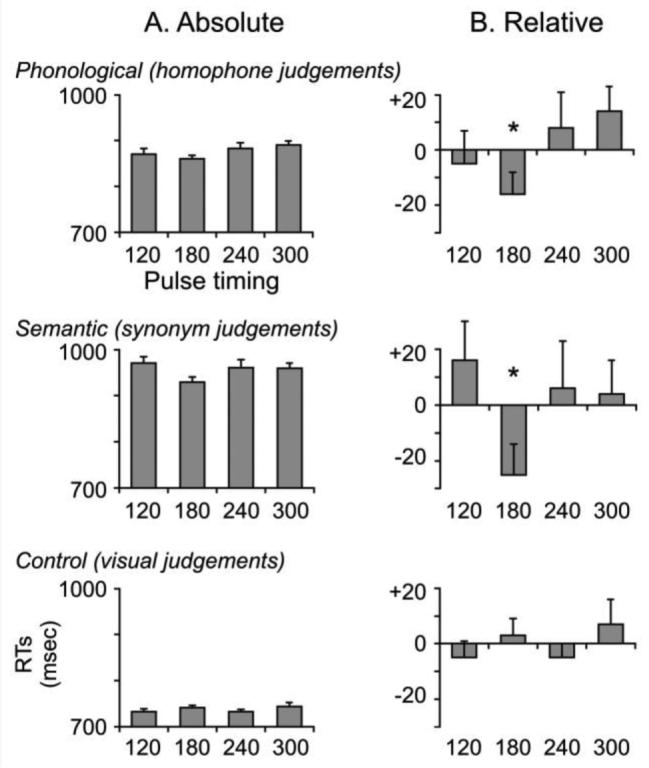
Figure 2.

Reaction times for all three tasks in the main experiment. A. The left column displays the absolute RTs from the onset of the visual stimulus for each of the four stimulation timings. The dashed line represents the mean RT across the four stimulation conditions. Note the scale of the y-axes are not identical due to the main effect of Task with visual < phonological < semantic decisions. B) The right column displays the timings relative to the task mean and reveals significant facilitation effects at 180 msec post-stimulus onset for both phonological and semantic judgements. The numbers above or below the bar plots are the effect sizes (in msec) from the mean. Error bars reflect standard error of the mean adjusted to correctly reflect the variance in the within-subject design (Loftus and Masson, 1994).
