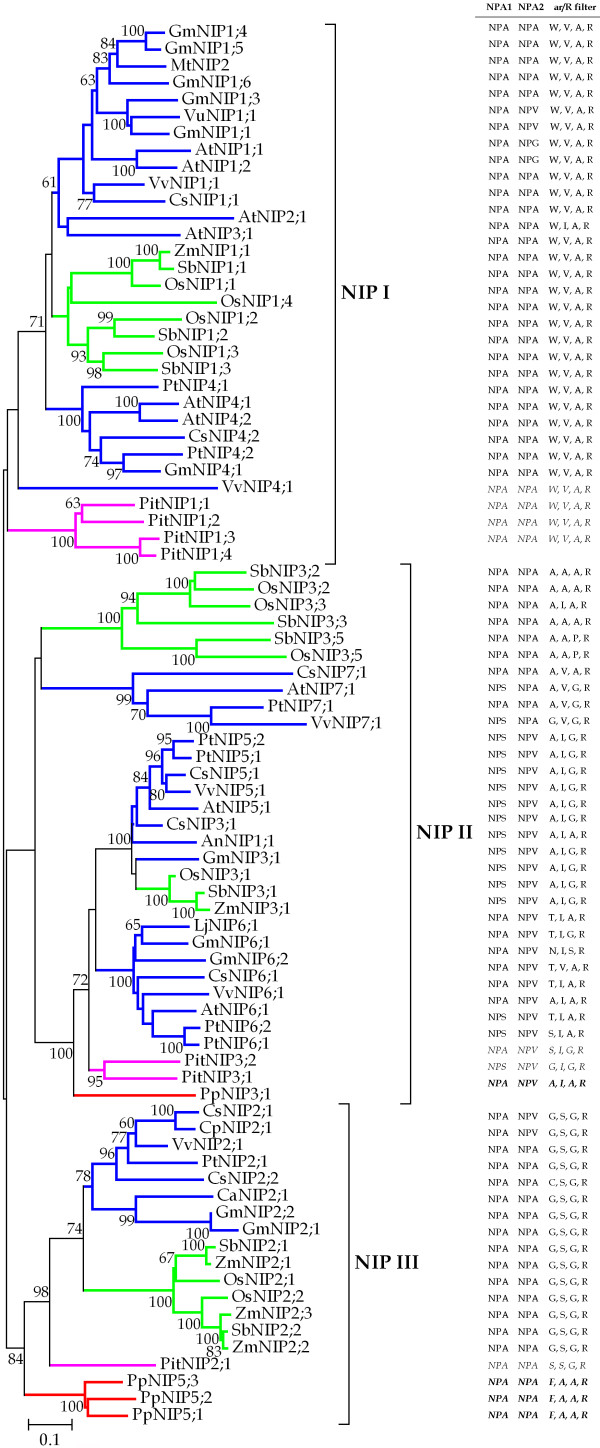
Figure 1.
Phylogenetic tree of NIP proteins in plants. The number beside the branches represents bootstrap values ≥ 60% based on 1000 resamplings. The scale is in amino acid substitutions per site. The two NPA motifs and the four residues making up the ar/R filter are indicated in the figure. To identify the species of origin for each NIP gene, a species acronym is included before the gene name: An, Atriplex nummularia; At, Arabidopsis thaliana; Ca, Cicer arietinum; Cp, Cucurbita pepo; Cs, Cucumis sativus; Gm, Glycine max; Lj, Lotus japonicus; Mt, Medicago truncatula; Os, Oryza sativa; Pit, Pinus taeda; Pp, Physcomitrella patens; Pt, Populus trichocarpa; Sb, Sorghum bicolor; Vu, Vigna unguiculata; Vv, Vitis vinifera; Zm, Zea mays.

