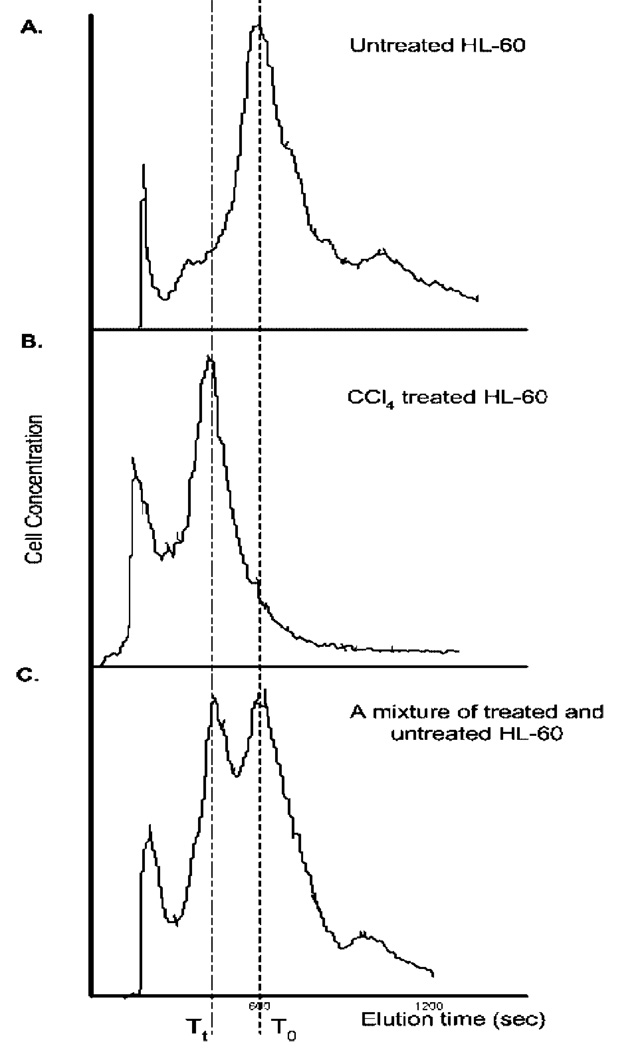
Figure 3.
(A) dFFF elution profile for untreated HL-60 cells. The time of emergence of the peak, T0, was taken to represent the baseline characteristics of the cells. (B). After treatment with toxicant, in this case CCl4 at 15 mmol·L−1 for 30 min, the cell elution peak emerged at a shorter time, Tt, because of the effect of the toxicant on the membrane conductivity and capacitance. (C). dFFF elution profile for a mixture of untreated and CCl4-treated HL-60 cell culture. This was to confirm a change in elution time of treated cells. The relative change in the speed with which cells transited the chamber was taken as the measure of the response to the toxicant.

