
FIG. 5.
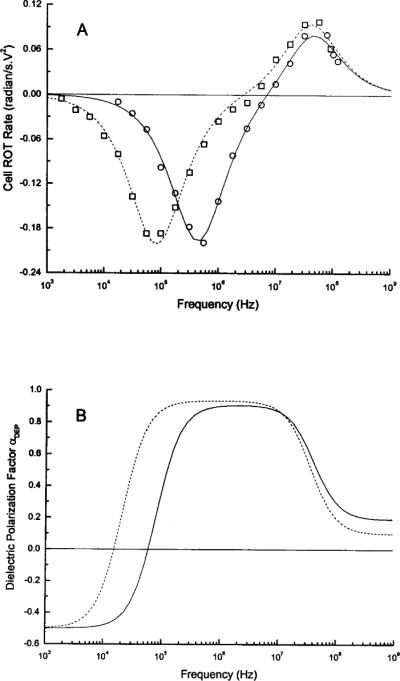
(A) Typical electrorotation spectra for CD34+ (circles) and MDA-435 (squares) cells in the sucrose buffer having a conductivity of 56 mS/m. Continuous curves show best fit of the single-shell dielectric model (30,31). (B) The frequency spectra of αDEP for CD34+ (solid) and MDA-435 (broken line) cells under separation conditions (conductivity 10 mS/m) calculated using the dielectric parameters (Table 1) derived from ROT measurements.