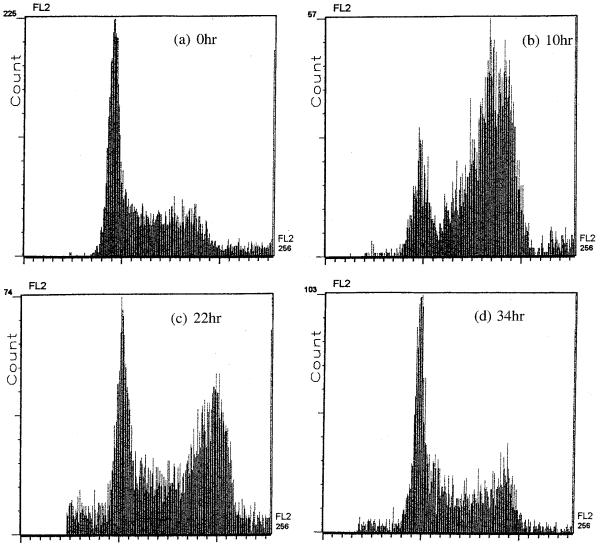
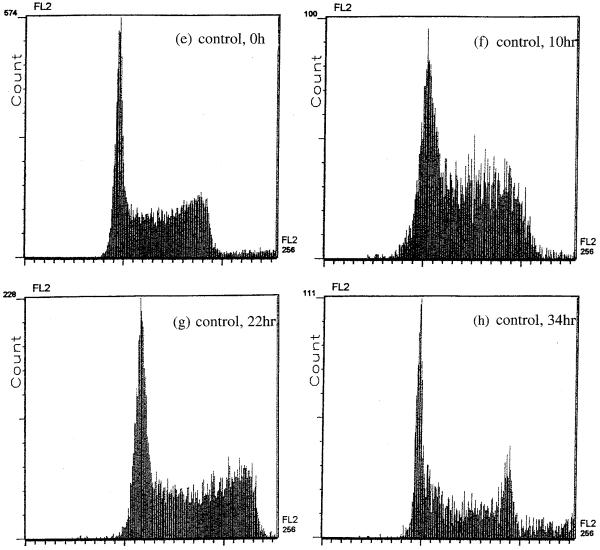
Fig. 4.
Flow cytometric study of cell cycle kinetics showing cell frequency versus DNA content at 0 h (a), 10 h (b), 22 h (c) and 34 h (d) after field exposure under the conditions (56 mS/m, 1 kHz, 5 V, 30 min). (e-h) Histograms for the corresponding control sample. At 10 h following field exposure, there was a significant increase in the frequency of cells in G2/M. At 22 h following exposure, there were still more cells than usual in G2/M. By 34 h, normal cell cycling has been re-established. From 10 to 34 h, some cells with a sub-G0 complement of DNA are apparent in the exposed sample, indicating that there was a subpopulation of dying cells.


