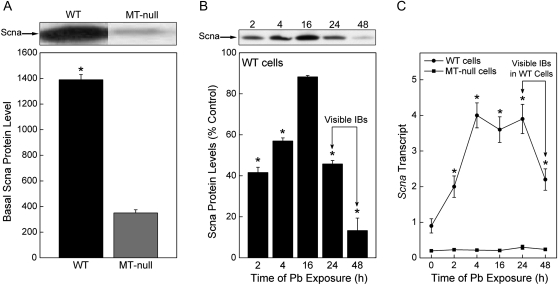
FIG. 5.
Basal Scna protein expression and Scna transcript after Pb treatment. (A) Basal Scna protein, commonly found in aggresomes, was measured by Western blot analysis. Blots were analyzed by scanning densitometry and are expressed as a relative protein level. An asterisk (*) indicates a significant (p < 0.05) difference from WT cells. (B) WT cells were treated with 200μM Pb for 0–48 h. Scna protein expression was measured by Western blot analysis. Blots were analyzed by scanning densitometry and are expressed as a % of control. An asterisk (*) indicates a significant (p < 0.05) difference from the control. (C) Scna mRNA levels were measured using real-time RT-PCR in triplicate. Results were normalized to β-actin and are expressed as a relative transcript level. Data are presented as the mean ± SEM, n = 3. An asterisk (*) indicates a significant (p < 0.05) difference from WT cells. The arrows indicate the approximate time Pb-induced IBs become visible by light microscope.

