


Figure 2.
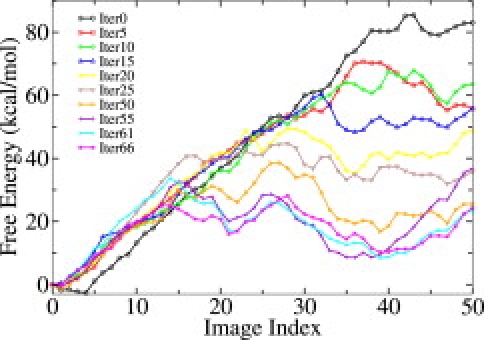
One-dimensional free energy profile along the activation pathways from iterations 0, 5, 10, 15, 20, 25, 50, 55, 61 and 66, showing the path is gradually being relaxed.
Official websites use .gov
A
.gov website belongs to an official
government organization in the United States.
Secure .gov websites use HTTPS
A lock (
) or https:// means you've safely
connected to the .gov website. Share sensitive
information only on official, secure websites.
One-dimensional free energy profile along the activation pathways from iterations 0, 5, 10, 15, 20, 25, 50, 55, 61 and 66, showing the path is gradually being relaxed.