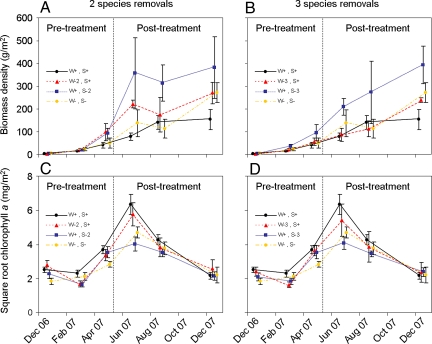
Fig. 2.
Ecosystem process rates in the experiment. Levels of secondary production (A and B) and primary production (C and D) in the experimental mesocosms (± SEM) at each of 6 different sampling sessions. Three of these sessions occurred before the interaction strength manipulation (pretreatment) and 3 after (posttreatment). In the key, W+S+ = an intact community; W−2S+ = 2 weakest interactors removed; W−3S+ = 3 weakest interactors removed; W+S−2 = 2 strongest interactors removed; W+S−3 = 3 strongest interactors removed; and W−S− = all strong and weak interactors removed. Data were transformed for statistical analyses, but original values are shown here for clarity.

