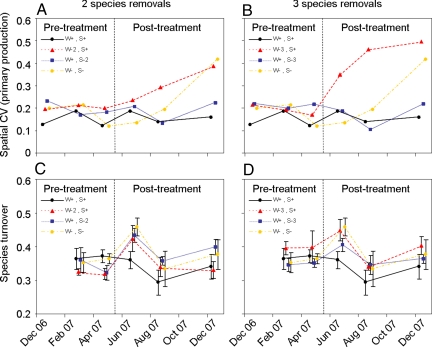
Fig. 4.
Spatial stability and resistance of the mesocosm communities. (A and B) Spatial stability effects in the experiment, measured as the coefficient of spatial variation (spatial CV) of primary production. Each data point represents a single measure calculated across the replicates within each treatment. Therefore, no y axis error bars are included in the plot. (C and D) Resistance of the experimental mesocosm communities to invasions and extinctions, measured as the species turnover (beta diversity) between consecutive sampling sessions. The first sampling session took place in December 2006, so there is no comparison for species turnover in this month. In the key, W+S+ = an intact community; W−2S+ = 2 weakest interactors removed; W−3S+ = 3 weakest interactors removed; W+S−2 = 2 strongest interactors removed; W+S−3 = 3 strongest interactors removed; and W−S− = all strong and weak interactors removed.

