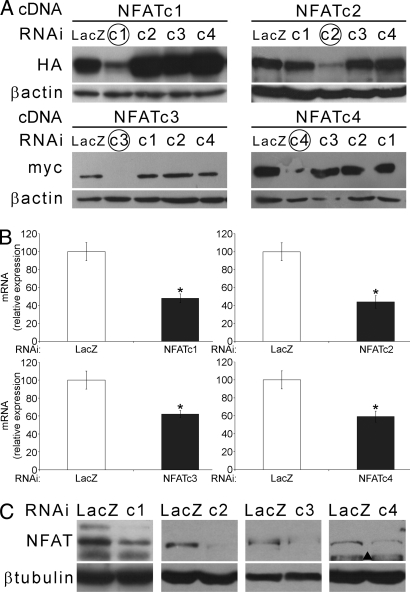
Fig. 3.
RNAi of individual NFATs. (A) WB showing specific down-regulation of the target NFAT (HA or myc-tagged as indicated), but not of other isoforms obtained by cotransfection of NFAT cDNA and isoform-specific siRNAs in HEK293 cells. Down-regulation of endogenous NFATs in muscles transfected with NFAT isoform-specific and control siRNAs is shown by qPCR at the RNA (B) and by WB at the protein level (C). ▴, aspecific band.

