Fig. 1.
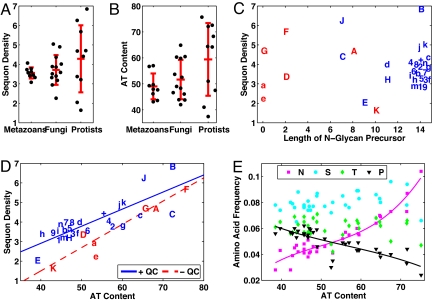
The density of sequons is positively correlated with the AT richness of the coding regions of each eukaryote. (A) Sequon densities (average number of sequons per 500 aa plus SD) for the secreted and membrane proteins are similar among metazoans and fungi but are much more variant among protists. (B) AT contents of coding regions of predicted secreted and membrane proteins are also similar among metazoans and fungi but are much more variant among protists. (C) Sequon density is not directly related to length of N-glycan precursors, where metazoans are numbered [Anopheles gambiae (1), Caenorhabditis elegans (2), Canis familiaris (3), Ciona intestinalis (4), Danio rerio (6), Drosophila melanogaster (5), Homo sapiens (7), Muris muscularis (8), and Tetraodon nigroviridis (9). Fungi are in lowercase [Antonospora locustae (a), Aspergillus nidulans (b), Candida albicans (c), Cryptococcus neoformans (d), Encephalitozoon cuniculi (e), Gibberella zeae (f), Kluyveromyces lactis (g), Magnaporthe grisea (h), Neurospora crassa (i), Saccharomyces cerevisiae (j), Schizosaccharomyces pombe (k), Ustilago maydis (m), and Yarrowia lipolytica (n)]. Protists are in uppercase [Cryptosporidium parvum (A), Dictyostelium discoideum (B), Entamoeba histolytica (C), Giardia lamblia (D), Leishmania major (E), Plasmodium falciparum (F), Theileria anulata (G), Trypanosoma cruzi (H), and Trichomonas vaginalis (J)]. One plant (Arabidopsis thaliana) is marked with a plus sign. Eukaryotes that have N-glycan-dependent QC of glycoprotein folding are marked in blue. Eukaryotes that lack N-glycan-dependent QC of glycoprotein folding are marked in red. (D) Sequon density is positively correlated with AT content of secreted and membrane proteins of all eukaryotes (R2 values are 0.68 and 0.89 for blue and red lines, respectively). An analysis of variance shows AT content accounts for 63% of the variance, whereas N-glycan-dependent QC accounts for 11%. The percentage of predicted secreted and membrane proteins with at least 1 sequon is also correlated with the AT richness (Fig. S1). In addition, when AT content is ≤55%, the sequon densities of secreted proteins of eukaryotes with N-glycan-dependent QC (marked in blue) are significantly greater than those of eukaryotes without QC (marked in red) by using rank-sum test at α = 5%. (E) Sequon density is positively correlated with AT content, because Asn is encoded by AA(TC), whereas Pro, which cannot be in sequons, is encoded by CC(AGCT) (R2 values are 0.91 and 0.71 for Asn and Pro, respectively).

