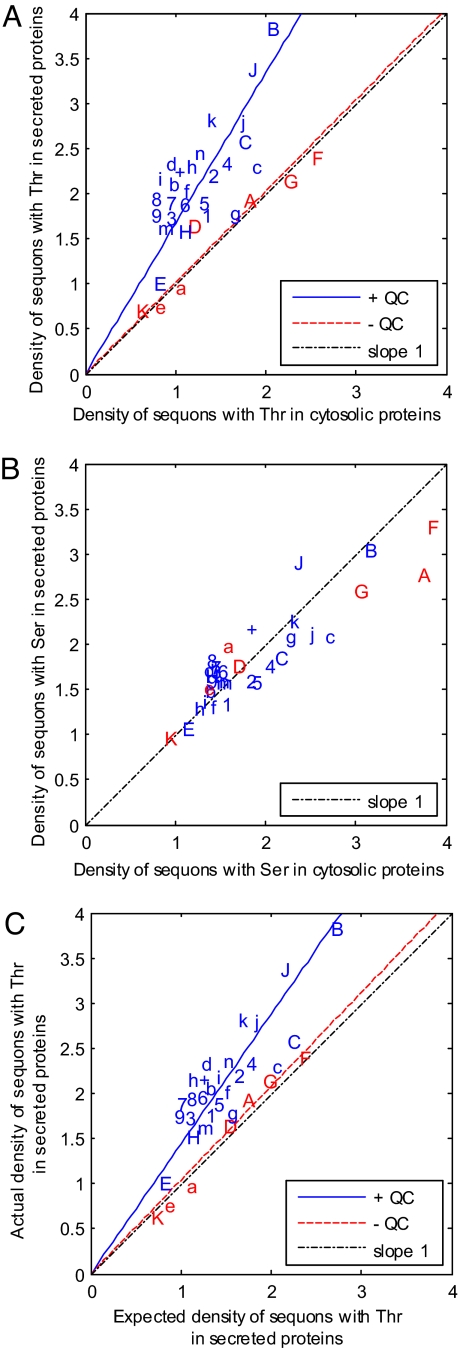
Fig. 2.
Darwinian selection for sequons with Thr in the secreted and membrane proteins of eukaryotes with N-glycan-dependent QC of proteins folding is based for the most part on an increased conditional probability that Asn and Thr will be present in sequons rather than elsewhere in these proteins. (A) Density of sequons with Thr (number per 500 aa) in secreted and membrane proteins versus nucleocytosolic proteins (negative controls) for each organism, which are abbreviated as in Fig. 1. In the case of eukaryotes that have N-glycan-dependent QC of glycoprotein folding and are marked in blue, there is moderately strong selection for sequons with Thr, so that the slope of the blue line is 1.7 (R2 = 0.46) rather than 1. In contrast, eukaryotes that lack N-glycan-dependent QC of glycoprotein folding and are marked in red show no selection, so the slope of the red line is 1.1 (R2 = 0.91). (B) Density of sequons with Ser (number per 500 aa) in secreted and membrane proteins versus nucleocytosolic proteins for each organism. There is no selection for or against sequons with Ser in eukaryotes with or without N-glycan-dependent QC, so that all points fall on the dotted line with the slope of 1 and intercept of 0. (C) The mechanisms for positive selection for sequons with Thr is shown by plotting the actual density of sequons with Thr in secreted and membrane proteins versus that calculated by the Asn, Thr, and Pro frequencies for each organism (i.e., the expected density). In eukaryotes with N-glycan-dependent QC that are marked in blue, there is an increased conditional probability that Asn and Thr will be in sequons rather than elsewhere in secreted proteins, so that the slope of the blue line is 1.5 (R2 = 0.74). In contrast, there is no increased conditional probability that Asn and Thr will be in sequons rather than elsewhere in secreted proteins of eukaryotes without N-glycan-dependent QC, so that the slope of the red line is 1.0 (R2 = 0.98). In Fig. S2, a small positive selection for amino acid composition bias and negative results for AT-content bias are shown.

