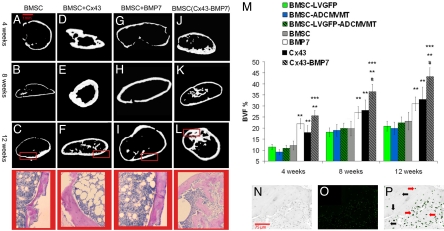
Fig. 4.
MicroCT renderings and histological sections (taken from regions of microCT images highlighted by red rectangle) of bone regenerated following transplantation of BMSCs (A–L). Different patterns of bone regeneration between BMSCs and BMSCs overexpressing Cx43 are observed. BVF quantifies these differences (M). Cells transduced with Cx43 and cotransduced with BMP-7 form larger volumes of tissue compared to BMSCs. Contrast image (N), image of GFP fluorescence (O), and co-localized image (P) of the same section of tissue regenerated 12 weeks after transplantation of BMSCs overexpressing Cx43. The continued extent of the GFP-Cx43 fusion gene expression is observed. Significant increases are indicated by ** vs. BMSC, *** vs. Cx43, # vs. BMP-7.

