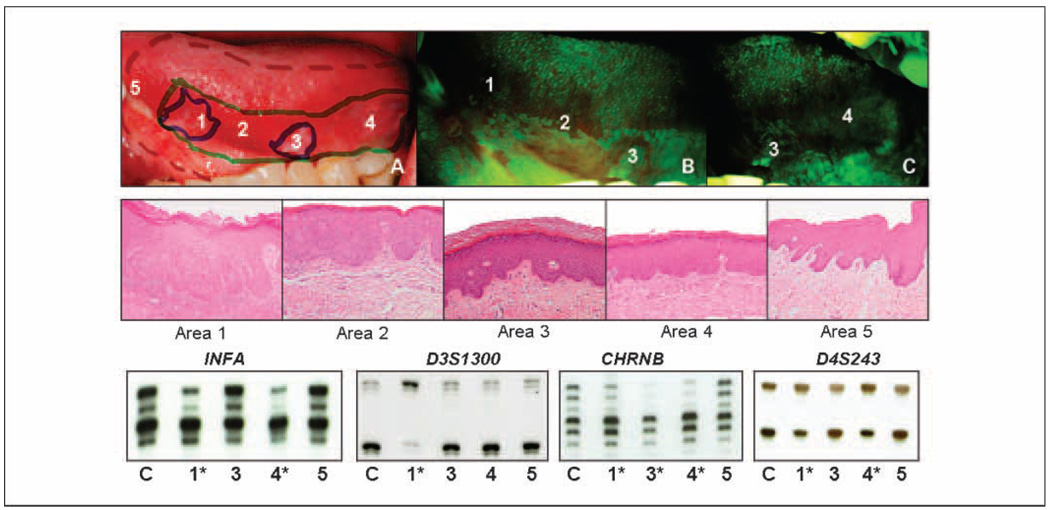
Fig. 1.
Mapping histologic and molecular change within an autofluorescence-defined, at-risk field. This figure illustrates the real-time mapping of a surgical field around a carcinoma in situ with subsequent integration of histologic and molecular information. High-grade histology and abnormal molecular clones are apparent in regions of autofluorescence loss lying outside of the clinically apparent tumor. A, delineation of three boundaries in the operating room (top): clinically apparent tumor (solid blue marker), autofluorescence loss (solid green marker), and surgical boundary (dotted red marker); the field in A is shown under white light, and in B and C under autofluorescence imaging. Areas 1 and 3 are clinically apparent and show autofluorescence loss, areas 2 and 4 are not clinically apparent but have autofluorescence loss, area 5 represents the anterior surgical margin, which is beyond the clinical tumor and boundaries of autofluorescence loss. Photomicrographs of areas indicated in A (middle, H&E staining with original magnification, ×100): area 1, carcinoma in situ; area 2, severe dysplasia; area 3, moderate epithelial dysplasia; area 4, mild-to-moderate epithelial dysplasia; area 5, no dysplasia. Loss of heterozygosity analysis at IFNA, D3S1300, CHRNB, and D4S243 (bottom). Numbers under each set of alleles correspond to areas in A (top; samples from area 2 were not available for analysis). *, presence of loss of heterozygosity in a sample.

