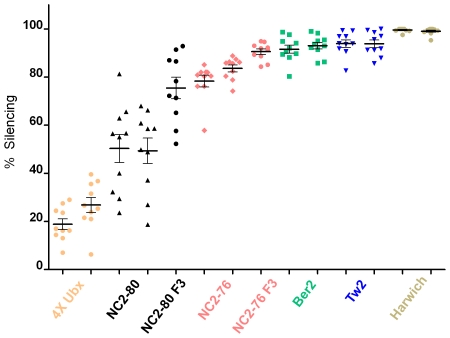
Figure 6. Quantification of silencing.
Each point records the % silencing of the Ubx-Gal4lac1 enhancer trap for a single haltere disc. % silencing is defined as the amount of non-stained tissue relative to wild type controls measured in parallel (see Materials and Methods for details). Unless otherwise indicated, all measurements were of haltere discs from F1 animals grown under non-crowded conditions produced by crossing our laboratory Ubx-Gal4lac1 stock to the indicated genetic backgrounds (4× Ubx, orange circles; NC2-80, black triangles; NC2-76, pink diamonds; Ber2, green squares; Tw2, blue triangles; Harwich, tan circles). Silencing was measured in two independent sets of crosses, separated in time by two weeks, and are graphed in neighboring columns. The thick black bars correspond to averages and the thinner bars show the standard error of the mean. For each cross, a minimum of 10 haltere discs, from 10 different animals, were scored. An analysis of variance (ANOVA) shows that the differences among the five wild type genotypes (NC2-80, NC2-76, Ber2, Tw2 and Harwich) in % silencing were highly significant (t ratio = 9.4, p = 0.0007) with 83% of the variance among lines, and no differences between replicates. Also graphed is the % silencing measured in 10 independent haltere discs resulting from the continued introgression (F3 generations) of Ubx-Gal4lac1 into the NC2-80 background (black circles) and into the NC2-76 background (pink circles). The average % silencing increased in the F3 generations compared to the F1 generations.

