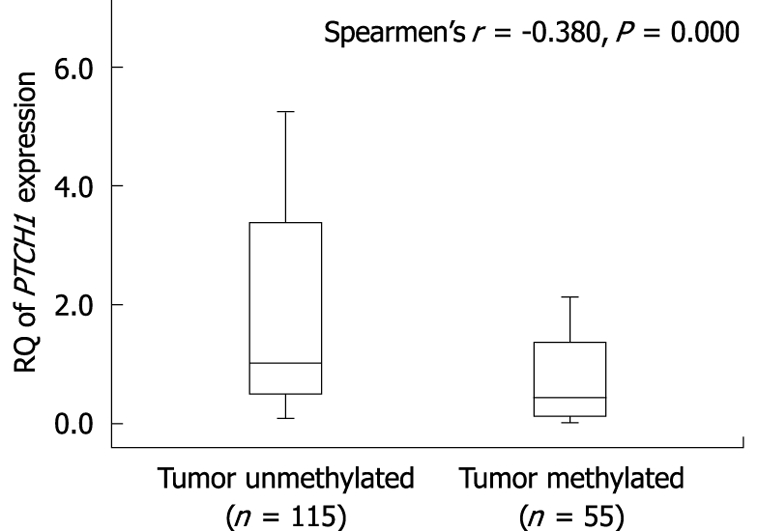
Figure 3.

Correlation between methylation of PTCH1a gene TRR and expression of PTCH1 in gastric cancer tissues. Box plot illustrating the loss of PTCH1 gene expression in relation to the methylation of PTCH1a gene TRR in human gastric cancer tissues (n = 170). The Y axis indicates the RQ value of PTCH1 gene mRNA expression was calculated in comparison with a calibrator (the expression level of pooled adjacent normal tissue samples). Horizontal lines: Group medians; Boxes: 25%-75% quartiles; Vertical lines: Range, peak and minimum.
