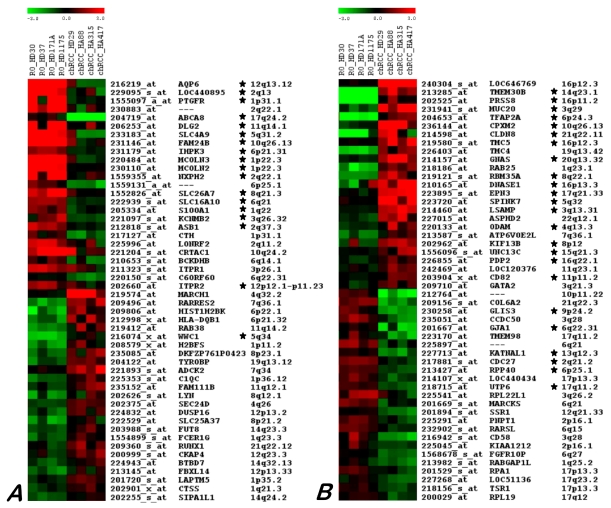
Figure 3.
Twenty five genes up- and down-regulated in ROs (A) and chRCC (B) as identified by microarray hybridization analysis using individual samples. Each row represents a single probe set, whereas each column represents a single sample. The coloured scales at the top represent the expression ratios of genes. Green squares indicate transcript levels below the mean value; black squares a transcript level equal to the median normal value and red squares a transcript levels higher than the mean value. Genes proved by real time RT-PCR are marked by star.

