
Figure 5.
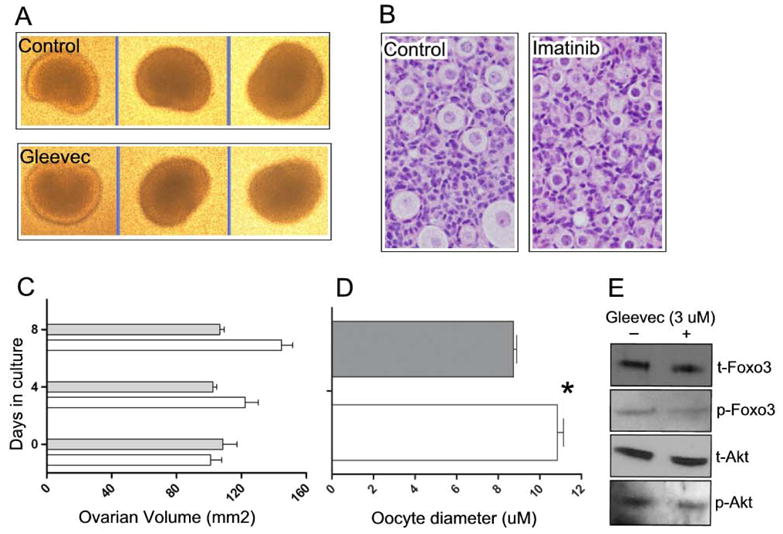
Effects of imatinib treatment on ovary and follicle size in vitro. Ovaries were explanted on the day of birth and placed in culture media +/− 3 μM imatinib. A) Representative photographs of ovaries after 8 days of culture. B) H&E stained sections of treated and untreated ovaries. Imatinib treatment results in decreased average oocyte size. C) Ovarian volume in untreated vs. treated ovaries. Imatinib treatment results in decreased average ovarian volume, (n=3 ovaries; error bars = s.e.m.). D) Average oocyte diameters (n=3 ovaries; error bars = s.e.m.). Asterisk indicates P value <0.05 per student’s t test. For C and D, grey bars = imatinib treated; white bars = untreated controls. E) Western analyses of imatinib-treated and untreated controls. t=total protein; p=phosphorylated protein.