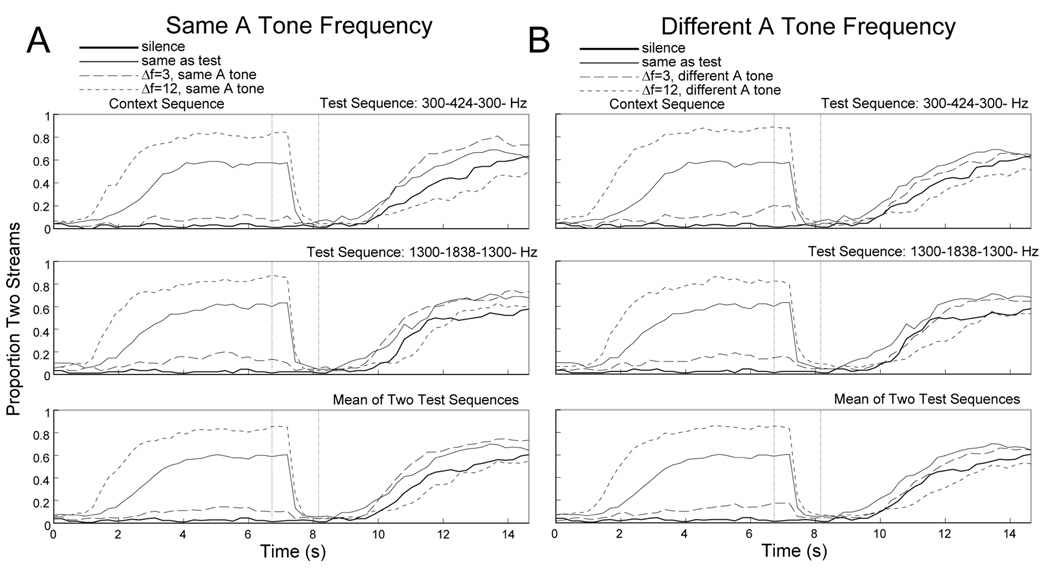
Figure 3. Effect of stimulus context in Experiment 1B.
Similar to Figure 1 except the top panels include trials in which the test sequence was 300-424-300-, the middle panels include trials in which the test sequence was 1300-1838-1300-, and the bottom panels show the mean across these two test sequences.

