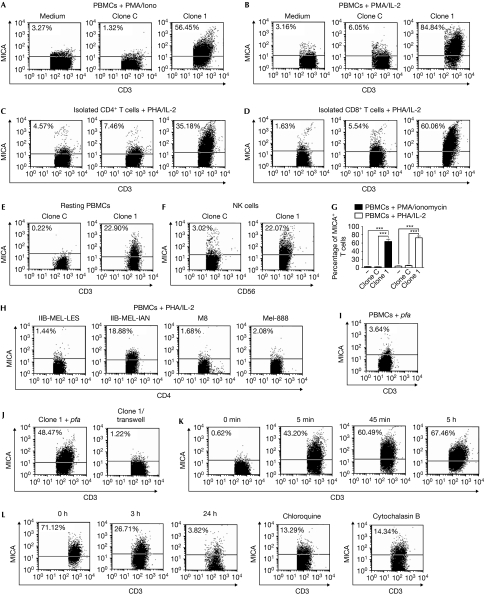
Figure 3.
Transfer of major histocompatibility complex class I chain-related protein A to T cells. (A) Peripheral blood mononuclear cells (PBMCs) stimulated with phorbol-12-myristate-13-acetate (PMA) and ionomycin (Iono) or (B) phytohaemagglutinin (PHA) and interleukin (IL)-2, (C) purified CD4+ T cells or (D) CD8+ T cells stimulated with PHA and IL-2, (E) resting PBMCs or (F) natural killer (NK) cells stimulated with IL-15 were cultured without (medium) or with tumour clone C or tumour clone 1 for 1 h and major histocompatibility complex class I chain-related protein A (MICA) was detected on non-adherent CD3+ T cells (A–E) or CD56+ cells (F). (H) Similar experiments were carried out with the indicated cell lines and MICA expression was assessed on CD4+ T cells. (I) Similar experiments as in (B) were carried out with fixed PBMCs (p-formaldehyde (pfa)). (J) PBMCs stimulated with PMA+Iono were co-cultured for 1 h with tumour clone 1 previously fixed with pfa, or with live cells of tumour clone 1 separated by transwells (clone 1/transwell), and MICA was assessed on CD3+ T cells. (K) Kinetic analysis of MICA on T cells stimulated with PMA+Iono on co-culture with tumour clone 1 for different periods of time (indicated at the top of each dot plot). 0 min: MICA on stimulated T cells not co-cultured with tumour clone 1. MICA expression was assessed as in (J). (L) PBMCs stimulated with PHA+IL-2 co-cultured for 1 h with tumour clone 1 were harvested, cultured alone for 3 or 24 h (in this case, in the absence or in the presence of chloroquine or cytochalasin B), and MICA was assessed as in (J). 0 h: MICA on activated T cells co-cultured with clone 1 for 1 h analysed immediately after co-culture. Numbers within dot-plots show the percentage of MICA+ cells. One of four representative experiments carried out with PBMCs from four different donors is shown. The mean±s.e.m. of these experiments is shown in (G). ***P<0.001. The increase in cell-surface MICA on T and NK cells co-cultured with tumour clone 1 was statistically significant, compared with equivalent cells cultured alone (P<0.05; data not shown).

