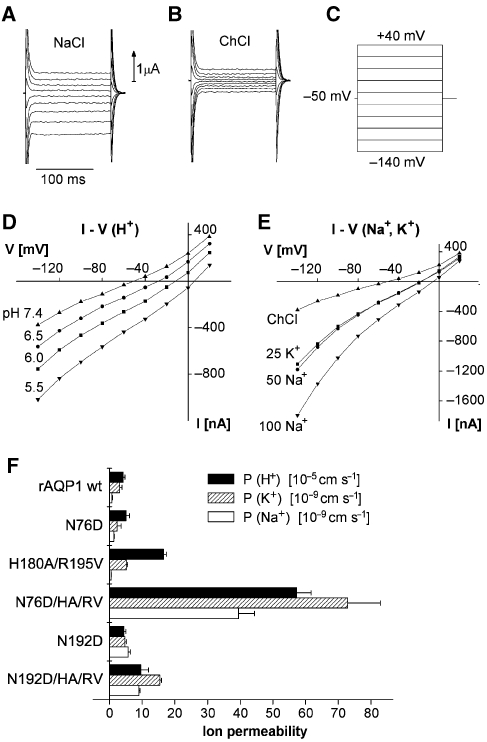
Figure 3.
Ion permeability of AQP1 mutants. Current–voltage relationships were obtained by the two-electrode voltage-clamp technique (Beitz et al, 2006). A series of voltage steps were applied and the resulting steady state currents recorded. The examples are from an oocyte expressing AQP1-N76D/H180A/R195V bathed in 100 mM NaCl (A) or in 100 mM ChCl (B), the latter also served as control bathing solution. All solutions contained an additional (mM) 2 KCl, 1 CaCl2, 1 MgCl2, 10 HEPES or MES, and pH was adjusted using Tris base. (C) The voltage was changed from a holding potential of −50 mV to a value between +40 and −140 mV in steps of 20 mV and the current was read after 100 ms. The test solutions were applied for about 30 s, at which time the voltage steps were applied. (D) Steady state currents obtained in 100 mM ChCl at an external pH of 7.4, 6.5, 6.0, or 5.5. (E) Steady state currents plotted as a function of voltage in 100 mM choline chloride (ChCl), in 25 mM KCl + 75 mM ChCl (25 K+), in 50 mM NaCl + 50 mM ChCl (50 Na+), and in 100 mM NaCl (100 Na+). (F) Permeability (P) for H+, Na+, and K+, please note the different scales. The P-values were calculated from the clamp currents (IC) obtained at a clamp voltage V of −120 mV from the equation P=ICRT/(VF2C), an approximation to the Goldman–Hodgkin–Katz equation applicable at high negative potentials. C is the concentration, F is the Faraday's constant, and R is the gas constant. Values for the wild-type AQP1 (rAQP1 wt) and the mutants AQP1-N76D, AQP1-H180A/R195V, AQP1-N76D/H180A/R195V, AQP1-N192D, and AQP1-N192D/H180A/R195V are shown. Currents observed with uninjected oocytes were not significantly different from oocytes expressing wild-type AQP1. n=5–14, ±s.e.m.

