Fig. 5.
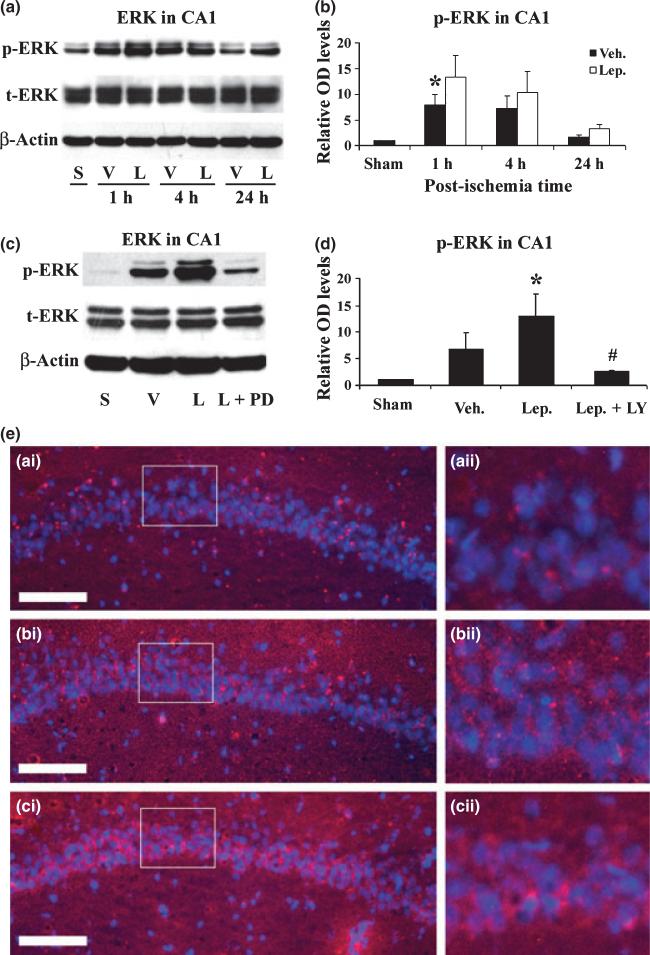
Leptin enhances the phosphorylation of ERK1/2 in hippocampal CA1 after ischemia. (a) Representative western blots showing the levels of p- and t-ERK1/2 in the CA1 region at serial time points following ischemia. S: sham-operated; V: vehicle-treated ischemia; and L: leptin-treated ischemia. (b) The average levels of p-ERK1/2 in the CA1 region were increased in the leptin-treated ischemia group at 1 h and 4 h following global ischemia. Data are presented as means ± SEM, assessed by anova and post hoc Scheffe's tests. *p < 0.05 vs. vehicle-treated ischemia group at the same time point. (c) Representative western blots showing p- and t-ERK1/2 levels in the CA1 region at 1 h following ischemia. S: sham-operated; V: vehicle-treated ischemia; L: leptin-treated ischemia; and L+PD: leptin and PD98059-treated ischemia group. (d) The average levels of p-ERK in the CA1 region were quantified and showed an increase in the leptin-treated group at 1 h following global ischemia, which was abolished by the co-administration of PD98059. Sham: sham-operated; Veh.: vehicle-treated ischemia; Lep.: leptin-treated ischemia; and Lep+PD: leptin and PD98059-treated ischemia group. Data are means ± SEM, assessed by anova and post hoc Scheffe's tests. *p < 0.05 vs. vehicle-treated ischemia group, #p < 0.05 vs. leptin-treated ischemia group, > 0.05 vs. vehicle-treated ischemia group. (e) Representative photomicrographs of immunofluorescent stained p-ERk1/2 in the CA1 regions 1 h after global ischemia. p-ERK1/2 is primarily neuron-distributed and shown in red; and nuclei are counter-stained blue by Hoechst. (a-i) sham-operated; (b-i) vehicle-treated ischemia; and (c-i) leptin-treated ischemia. (a-ii), (b-ii) and (c-ii) demonstrate the magnified CA1 neurons whose origins are indicated by the boxes in (a-i), (b-i), and (c-i), respectively. Scale bar, 100 μm.

