
Figure 3.
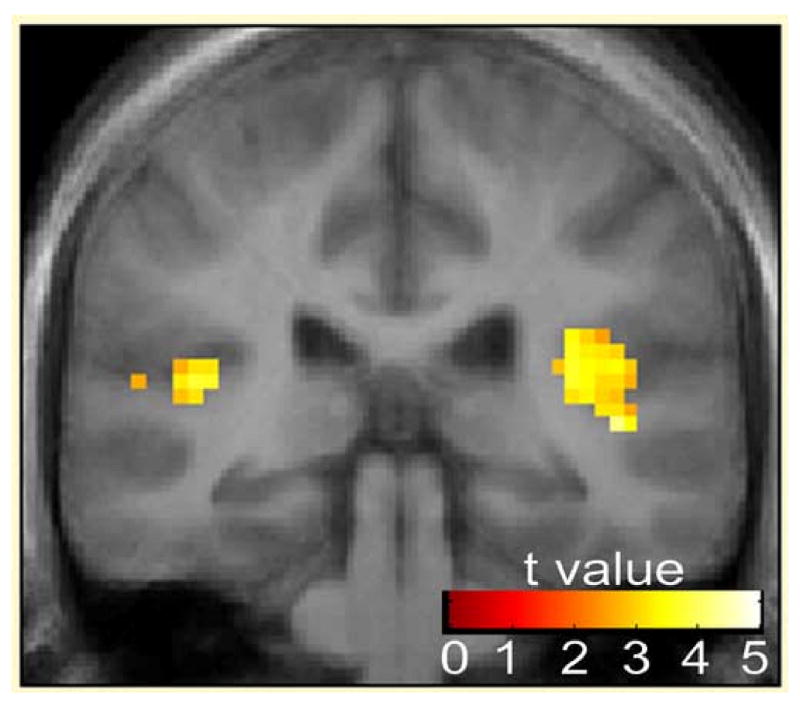
Activation across groups of bilateral primary auditory cortex in response to single click (N=24). Statistical parametric maps thresholded at P < 0.01, overlaid onto the average T1-weighted anatomy of all subjects. Local maxima located at x = -42, y = -33, z = -12 (left Heschl's gyrus), x = 42, y = -30, z = 12 (right Heschle's gryus)