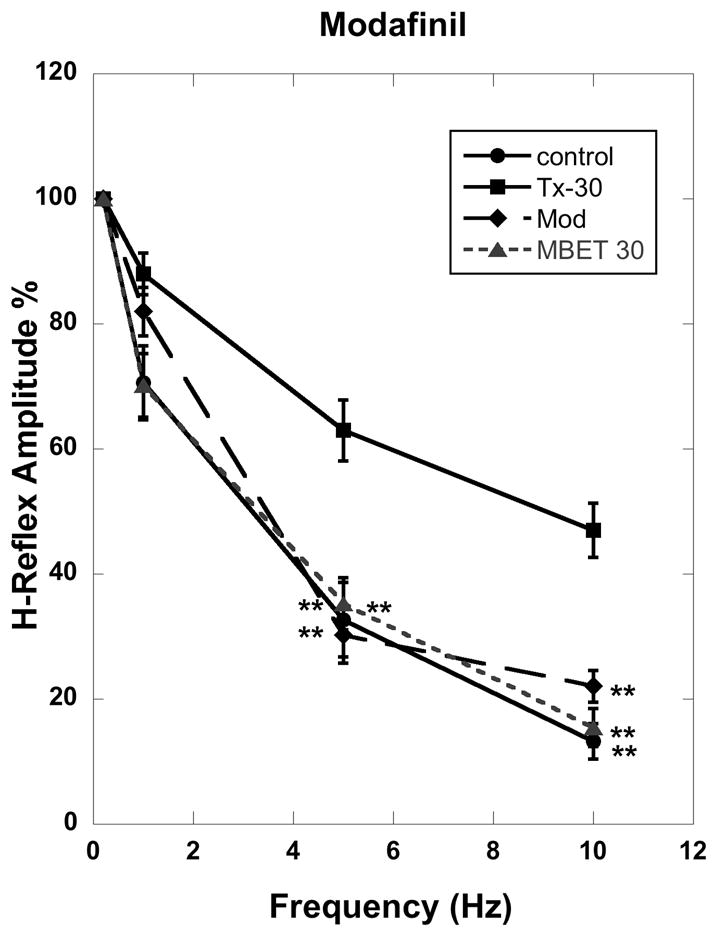
Figure 1.

H-reflex amplitude at 0.2, 1, 5 and 10 Hz for intact animals (Control, black circles), Tx only 30 days (Tx-30, square), MBET 30 days (Tx+ Ex 30D, triangle), and Modafinil 30 days (Mod, diamond). Frequency-dependent depression of the H-reflex at 0.2 Hz was designated 100%, and statistical comparisons made against the Tx only 30 day group. At 5 Hz and 10 Hz, the Tx Only 30 D group(Tx-30) differed from the MBET group ( triangle) (p<0.01), the Mod group (diamond) (p< 0.01), and the control group (black circle) (p<0.01).
