Figure 4.

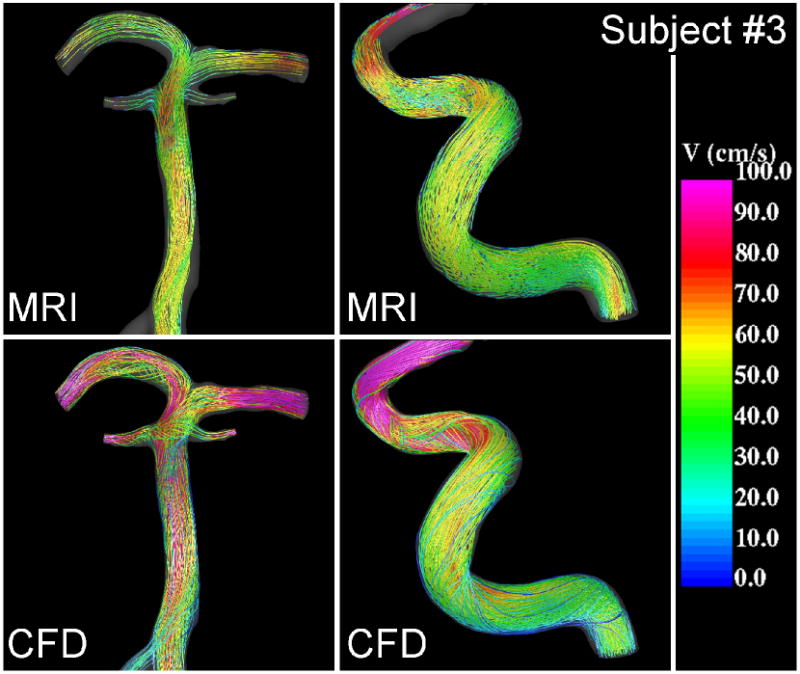
Visualizations of the blood flow patterns at peak systole in the basilar (left) and right internal carotid artery (right) of subject #3 obtained from the MRI (phase-contrast MR) data and CFD model.

Visualizations of the blood flow patterns at peak systole in the basilar (left) and right internal carotid artery (right) of subject #3 obtained from the MRI (phase-contrast MR) data and CFD model.