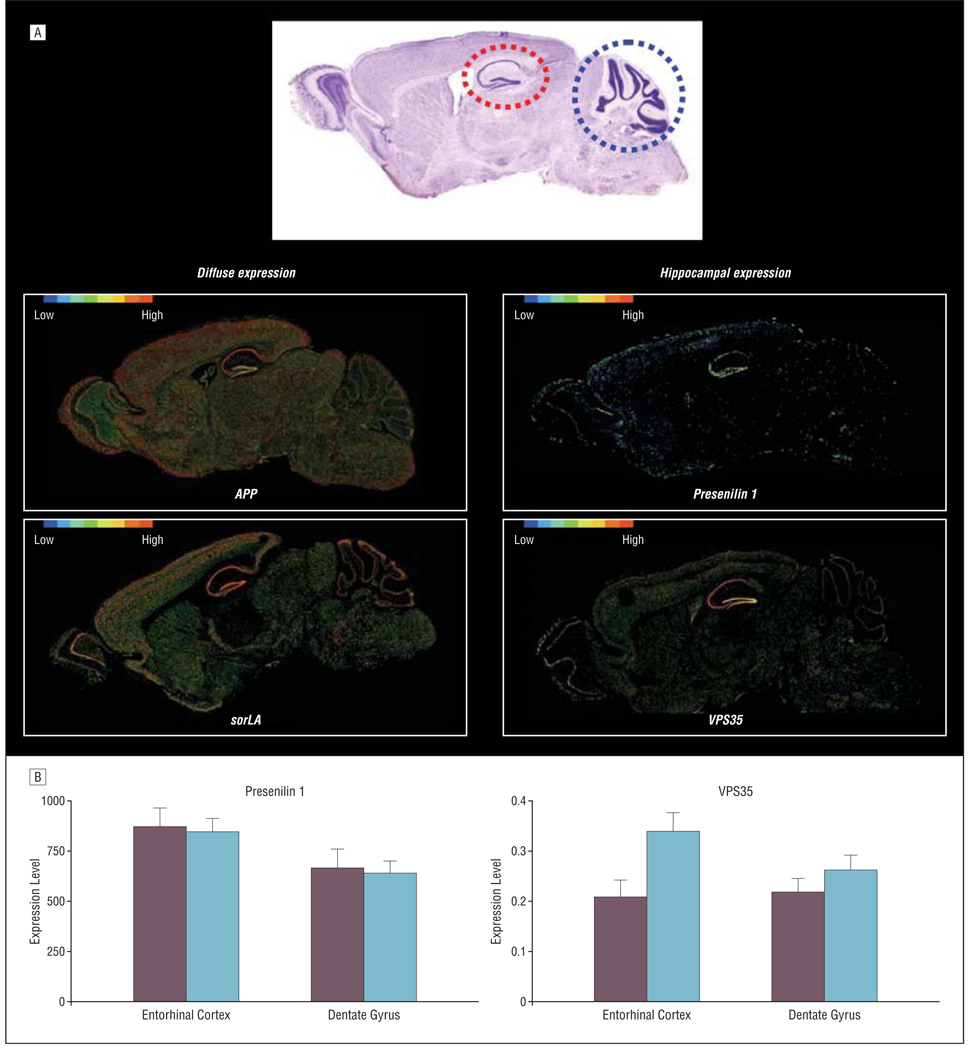
Figure 2.
Retromer and presenilin 1 are differentially expressed in the entorhinal cortex. A, Compared with the diffuse expression pattern of amyloid precursor protein (APP) and sorLA, presenilin 1, vacuolar protein sorting (VPS) 35, and VPS26 are differentially expressed in the hippocampal formation compared with the cerebellum. The mouse hippocampal formation (red stippled circle) and the cerebellum (blue stippled circle) are shown in a sagittal histological slice (upper panel). Gene expression maps (generated by the Allen Brain Atlas,21 lower panels) are color coded such that warmer colors reflect more expression of a particular gene, while cooler colors reflect less expression. B, Within the human hippocampal formation, presenilin 1 and VPS35 are differentially expressed in the entorhinal cortex compared with the dentate gyrus. Left panel shows messenger RNA expression levels of presenilin 1, as measured by Affymetrix HG-U133A GeneChip (Affymetrix, Santa Clara, California). Right panel shows protein expression levels of VPS35, as measured by quantitative Western blotting normalized to actin. For the entorhinal cortex, red bars indicate Alzheimer disease; orange bars, controls. For the dentate gyrus, light blue bars indicate Alzheimer disease; dark blue bars, controls.

