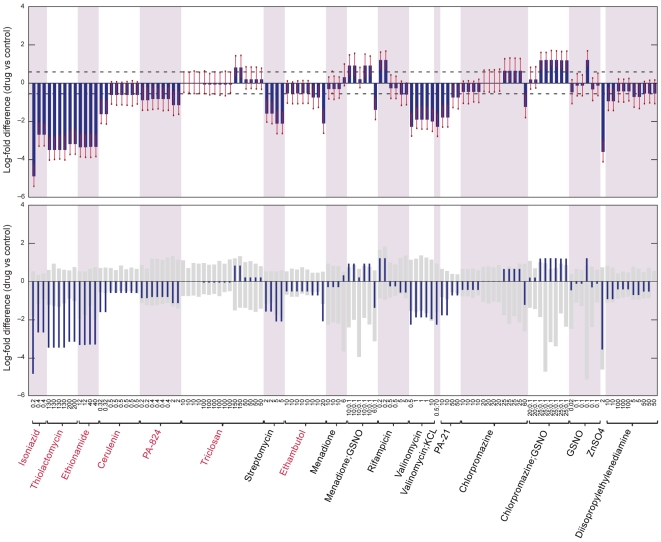
Figure 3. Selected predictions of E-Flux applied to mycolic acid biosynthesis in M. tuberculosis.
Top panel: predictions and prediction significance are displayed for each condition as described in Figure 2. Conditions are arranged on the x-axis as indicated by the labels. Many conditions are replicates of the same compound, possibly with different concentrations. Replicates are indicated by the background shading and brackets in the horizontal axis label. Numbers in the brackets are concentrations for each replicate. Bottom panel: the specificity of each prediction for mycolic acid biosynthesis is displayed. The dark bars indicate the prediction strength as in the top panel. The light grey bars indicate the 95% confidence interval for predictions made by randomizing gene labels. Dark bars smaller than light bars indicate non-specific predictions. Known fatty acid inhibitors are shown as red on the horizontal axis label.

