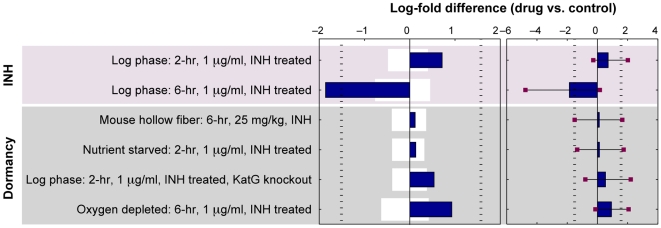
Figure 4. Predictions of E-Flux applied to data on M. tb's response to isoniazid under dormancy conditions.
Top panel: predictions and prediction significance are displayed for each condition as described in Figure 2. Isoniazid shows a significant effect after 6 hours but shows no comparable inhibition under dormancy conditions. Note that the lack of inhibitory effect shown at 2 hours may reflect incompleteness of the transcriptional at this time, in which case the most relevant comparison is to the oxygen depletion condition (6 hr) showing no significant inhibition for this dormany model. Bottom panel: the specificity of each prediction for mycolic acid biosynthesis is displayed. The dark bars indicate the prediction strength as in the top panel. The light grey bars indicate the 95% confidence interval for predictions made by randomizing gene labels.

