Fig. 5.
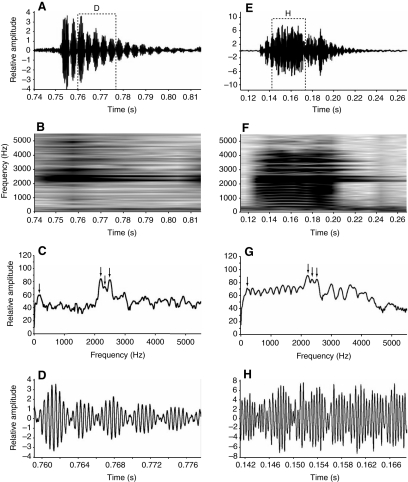
Examples of two representative grunts exhibiting acoustic beats from B. trispinosus. (A) Waveform, (B) spectrogram, (C) power spectrum, (D) and waveform with expanded time base of a individual grunt. Box in A indicates enlarged section in D. Arrows in C represent peaks at 194, 2196, 2326 and 2498 Hz. (D) Waveform, (E) spectrogram, (F) power spectrum and (G) waveform with expanded time base of a second grunt, showing beat structure and clear harmonics. Box in E indicates enlarged section in H. Arrows in G represent peaks at 194, 2196, 2348 and 2520 Hz. For spectrograms (B,F) and power spectra (D,H), FFT size=1028 samples.

