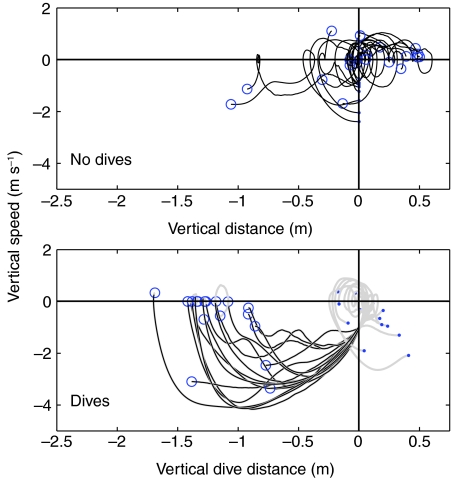
Fig. 2.
Classification of mantis responses into `dive' or `no-dive' based on its flight trajectory. Vertical distance traveled by each mantis is plotted against its corresponding vertical speed. Dive initiation was identified as the start of the first time segment when the downward vertical speed of the mantis continuously exceeded 1 m s–1 and it dropped more than 0.5 m during the same segment. Dive end point is identified as the time when the vertical speed turned positive, or when the mantis hit the ground. Dots show start of trajectory data and circles show end of trajectory data. In the dives plot, sections of the trajectory segmented as a dive are shown in black, whereas the rest of the trajectory is shown in gray.

