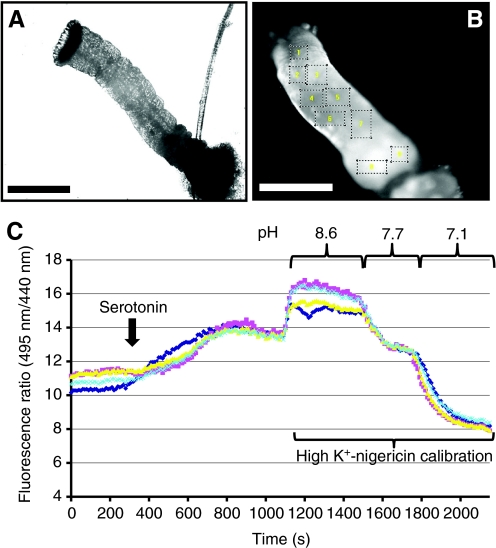
Fig. 1.
Experimental set-up for intracellular pH (pHi) monitoring of regions in the midgut of larval (4th instar) Aedes aegypti. (A) DIC image of the midgut preparation as observed on the experimental apparatus (scale bar 200 μm). (B) Corresponding fluorescence image (F495) of the same midgut from A following loading of the pH-sensitive dye BCECF-AM. Dotted boxes represent regions of interest that were used to observe ratiometric fluorescence changes (scale bar, 200 μm). (C) Representative traces of four regions of interest in the midgut and their corresponding fluorescence ratios (F495/F440) generated from excitation of cells loaded with BCECF-AM. This graph demonstrates the ability to convert observed changes in fluorescence ratios to pHi values by using the high K+-nigericin calibration for each individual cell.

