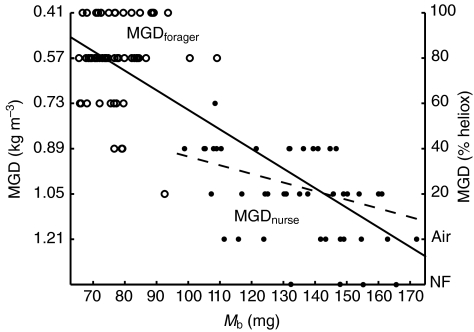
Fig. 2.
Maximal flight capacity (minimal gas density, MGD) vs body mass (Mb) for foragers (MGDforager; open symbols) and nurses (MGDnurse; filled symbols). Values of MGD (kg m–3) are inverted to reflect the increasing aerodynamic demand of flying in gas mixtures of lower density. Bees that were unable to fly in air (no flight, NF; right-hand y-axis) were plotted for descriptive purposes and were not included in the calculated MANCOVA or regressions. Model II regression: MGDforager=0.619–0.001Mb, R2<0.01, P=0.772; MGDnurse=0.613+0.003Mb, R2=0.18, P=0.006 (broken line). MGDtotal=0.061+0.007Mb, R2=0.66, P<0.001 (solid line).

