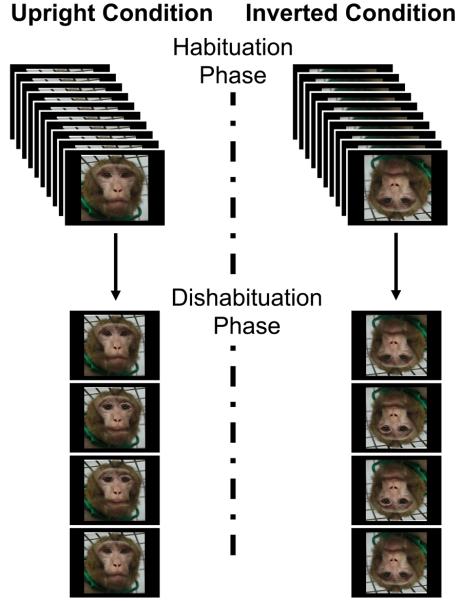
Fig. 2. Schematic of the habituation-dishabituation paradigm.
Half of tests used upright images (left side) and the other half inverted images (right side). Each image was presented for 30 seconds, separated from the next presentation by 10 seconds with no image. Each presentation was cued by a “beep.” Ten presentations of a given image constituted the habituation phase (top). The habituated (intact) and thatcherized faces were presented twice each in the dishabituation phase in an ABBA sequence (bottom). Whether an intact or thatcherized face was shown first in the dishabituation phase was counter-balanced across tests and monkeys.

