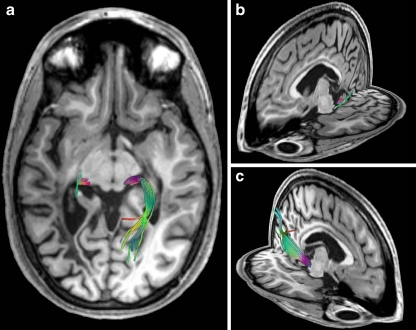
Fig. 4.
Fiber tractography of the patient’s geniculo-calcarine tract 4.8 years after onset of symptoms in three-dimensional views of fiber reconstructions relative to T1-weighted MRI anatomy: a top view and b,c oblique views of the left and right hemisphere, respectively. Colors correspond to the local mean diffusion direction: red left–right, green anterior–posterior, and blue superior–inferior

