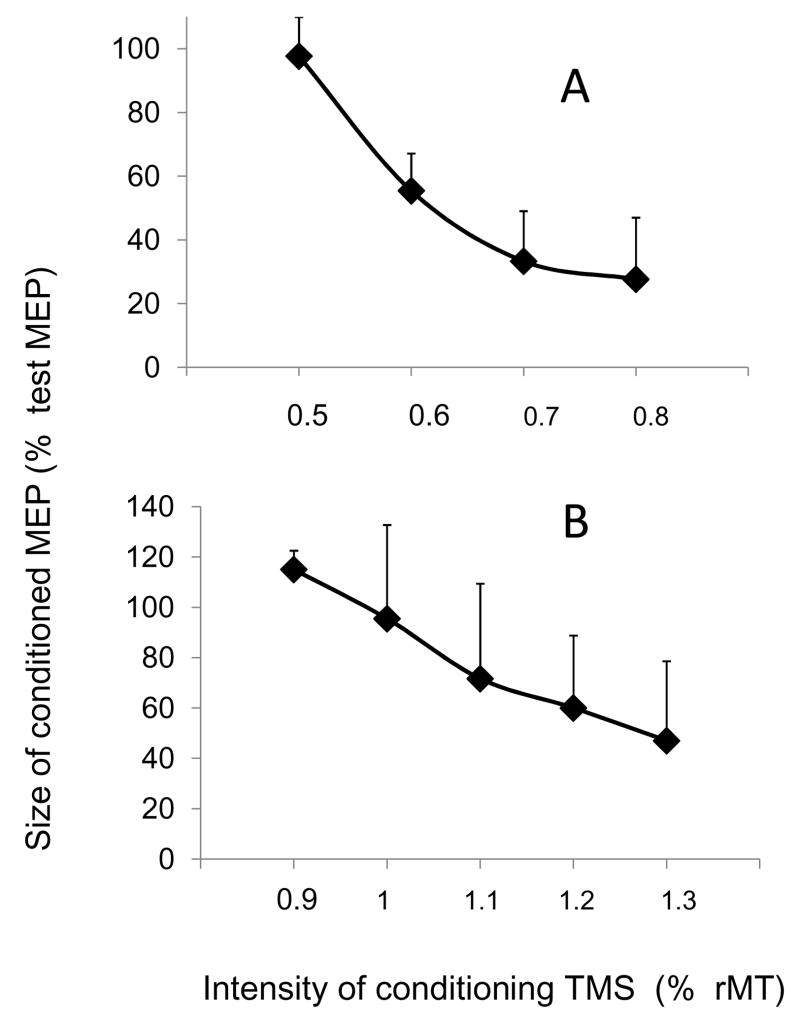
Figure 2. Intensity curves of SICI (A) and LICI (B).
The effect of a conditioning TMS pulse (CS) is tested on a 1 mV test MEP from FPB. In A: the ISI between CS and test stimulation was 2.5 ms; each dot represents the mean of 120 measurements (12 subjects). B: the ISI between CS and test stimulation was 90 ms; each dot represents the mean of 150 measurements (15 subjects).

