Fig. 5.

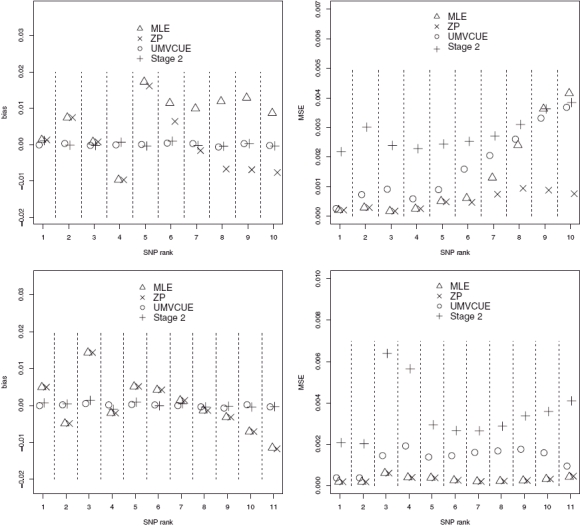
Top: Bias and MSE for T1D data. Bottom: bias and MSE for CD data. Numbers calculated using simulation method A, but with an assumed stage 1 of size 20,000 and stage 2 size 2,000. TID, type-1 diabetes; CD, Crohn's disease.

Top: Bias and MSE for T1D data. Bottom: bias and MSE for CD data. Numbers calculated using simulation method A, but with an assumed stage 1 of size 20,000 and stage 2 size 2,000. TID, type-1 diabetes; CD, Crohn's disease.